Fomapan reciprocity failure

totocalcio

A
totocalcio

  • 3
  • 0
  • 33
Untitled

A
Untitled

  • 5
  • 2
  • 91
Jerome Leaves

H
Jerome Leaves

  • 3
  • 0
  • 65
Jerome

H
Jerome

  • 2
  • 0
  • 69
Sedona Tree

H
Sedona Tree

  • 1
  • 0
  • 71

Forum statistics

Threads
197,437
Messages
2,758,970
Members
99,498
Latest member
spiewak2
Recent bookmarks
1
Joined
Sep 24, 2003
Messages
1,041
Location
Holland, MI
Format
Pinhole
I'm confused by apparently conflicting info.

I have a box of Fomapan 200. It doesn't say Creative, or other variant names. I downloaded a data sheet, it is shows what I have in the past called the worst 'old tech' reciprocity failure characteristics I have ever seen. 4 stops or x18 multiplier at 100 seconds.

As I'm browsing the Web, I see someone claiming Fomapan 200 Creative has high tech T-grain, blah-blah. I thought T-grain films were more modern than (pyramidal?) the old classic types, and the 4 stops and T-grain don't go together for me.


Someone else was discussing Efke 50, couldn't find data for reciprocity failure, and someone else provided Efke 25 data with increments like 1/3 stop at 1 sec, 1/2 at 10 sec and 2/3 at 100 sec.

THAT sounds like average T-grain film.

Now, I know Efke and Foma are not the same. Efke says Croatia I think and Foma said Czech Republic.

Maybe what's confusing me is the crossover packaging with Arista, Freestyle, & the former J&C, and 'helpful' statements from people that 'this and that' are the same, despite different brands.

I do also have some Efke 50 and wonder what behavior that film REALLY has,

Do I dare ask if there is any fact in the claims of various films changing source/manufacturer over a period of time? If that's the case, how does one know what one has stored if the data doesn't remain constant.

Thanks
 

gainer

Subscriber
Joined
Sep 20, 2002
Messages
3,703
Look up:

www.unblinkingyey.com/Articles/lirf

There are curves for a number of modern films from data by Howard Bond. You will see that all curves have the same slope within experimental error, and are straight lines on log-log paper. If you know the amount of exposure time to be added to any measured exposure time to correct for reciprocity, you can draw the line through that point on the chart parallel to the basic line. That line has 1.62 inches of rise per inch of run.
Somewhere on this forum I saw a link to a site where you can download log-log and other types of graph paper.
I advise not messing with f-stop corrections. For one thing, it messes up your depth of field. For another, it messes up your brain. Dedicate a roll of film to the task. Set up a low light situation and start with the nominal exposure, increasing the exposure time each frame by the same ratio. 2 is a good starting ratio. Develop the roll and find the frame that satisfies you most.
 
OP
OP
Murray@uptowngallery
Joined
Sep 24, 2003
Messages
1,041
Location
Holland, MI
Format
Pinhole
yey, those unblinking yeys.

How 'bout
Dead Link Removed

caps matter, if you blink.

BTW, have you ever tried it with Fomapan 200?

was should be
0.5 0.5
1 3
10 90
100 1800

That curve is pretty unpredictable between 0.5 and 1 second ;O)

Thanks.
 
OP
OP
Murray@uptowngallery
Joined
Sep 24, 2003
Messages
1,041
Location
Holland, MI
Format
Pinhole
OK. I did my own method of curve fit using CurveXpert. It 'shotguns' about 30 models and then recommends the best fit (lowest residual). Depending on how many decades (factors of ten, not 10 year increments!) of time one enters, there can be a lot of error at the low end, say 1-5 seconds. So I rerun with a smaller time range for short & long times, put two models in a spreadsheet with an IF statement, and print a chart.

That jump from 0.5 to 1 second is just too radical to fit with my method. I cannot get a decent fit at 0.5 (if only for checking smoothness of model).

I know mfr's data should take a back seat to actual measurements anyway.
--------------------------------
 
Last edited by a moderator:
OP
OP
Murray@uptowngallery
Joined
Sep 24, 2003
Messages
1,041
Location
Holland, MI
Format
Pinhole
OK, FWIW to anyone, following are 1-100 second exposure tables For Foma 100 Classic, 200 Creative and 400 Action, including reciprocity failure/Schwarzschild Effect modeled on the datasheets. Many find different curves work better for their purposes, but I'm just playing with curve-fitting software and matching the datasheet makes me happy for now. When I actually use the films, maybe that will be another story.

Excuse the formatting. It doesn't paste the way I thought.

I took the liberty of interpolating one point at 10^0.5 seconds.


Foma 100 Classic
1 1.9
2 6.0
3 11.6
4 19
5 27
6 36
7 46
8 56
9 68
10 80
11 93
12 106
13 120
14 135
15 150
16 165
17 181
18 197
19 213
20 230
21 247
22 265
23 282
24 300
25 318
26 336
27 355
28 374
29 392
30 411
31 430
32 449
33 469
34 488
35 507
36 527
37 546
38 566
39 585
40 605
41 624
42 644
43 663
44 683
45 702
46 722
47 741
48 761
49 780
50 799
51 818
52 837
53 856
54 875
55 894
56 913
57 932
58 950
59 969
60 987
61 1005
62 1023
63 1041
64 1059
65 1077
66 1094
67 1112
68 1129
69 1146
70 1164
71 1180
72 1197
73 1214
74 1230
75 1247
76 1263
77 1279
78 1294
79 1310
80 1326
81 1341
82 1356
83 1371
84 1386
85 1401
86 1415
87 1429
88 1444
89 1458
90 1471
91 1485
92 1499
93 1512
94 1525
95 1538
96 1551
97 1563
98 1576
99 1588
100 1600
--------------------------------------------------
Foma 200 Creative
1 3
2 9
3 16
4 24
5 33
6 43
7 54
8 65
9 77
10 90
11 103
12 117
13 131
14 145
15 160
16 175
17 191
18 207
19 223
20 240
21 257
22 274
23 291
24 309
25 326
26 344
27 362
28 381
29 399
30 418
31 437
32 456
33 475
34 494
35 514
36 533
37 553
38 573
39 592
40 612
41 632
42 652
43 672
44 692
45 713
46 733
47 753
48 773
49 794
50 814
51 835
52 855
53 875
54 896
55 916
56 937
57 957
58 978
59 998
60 1018
61 1039
62 1059
63 1080
64 1100
65 1120
66 1141
67 1161
68 1181
69 1201
70 1221
71 1242
72 1262
73 1282
74 1302
75 1322
76 1341
77 1361
78 1381
79 1401
80 1420
81 1440
82 1460
83 1479
84 1498
85 1518
86 1537
87 1556
88 1576
89 1595
90 1614
91 1633
92 1651
93 1670
94 1689
95 1708
96 1726
97 1745
98 1763
99 1782
100 1800
--------------------------------------------------
Foma 400 Action
table model
0.5 0.5 0.500000024
1.0 1.5 1.500000087
2.0 4.5
3.0 8.6
4.0 14
5.0 20
6.0 26
7.0 34
8.0 42
9.0 51
10.0 60.0 60
11.0 68
12.0 76
13.0 84
14.0 92
15.0 100
16.0 109
17.0 117
18.0 126
19.0 135
20.0 143
21.0 152
22.0 161
23.0 170
24.0 179
25.0 188
26.0 197
27.0 206
28.0 215
29.0 224
30.0 233
31.0 242
32.0 251
33.0 260
34.0 270
35.0 279
36.0 288
37.0 297
38.0 306
39.0 315
40.0 324
41.0 333
42.0 342
43.0 351
44.0 360
45.0 369
46.0 378
47.0 386
48.0 395
49.0 404
50.0 413
51.0 422
52.0 430
53.0 439
54.0 448
55.0 456
56.0 465
57.0 473
58.0 482
59.0 490
60.0 499
61.0 507
62.0 515
63.0 524
64.0 532
65.0 540
66.0 548
67.0 556
68.0 564
69.0 572
70.0 580
71.0 588
72.0 596
73.0 604
74.0 612
75.0 620
76.0 628
77.0 635
78.0 643
79.0 650
80.0 658
81.0 666
82.0 673
83.0 680
84.0 688
85.0 695
86.0 702
87.0 710
88.0 717
89.0 724
90.0 731
91.0 738
92.0 745
93.0 752
94.0 759
95.0 766
96.0 773
97.0 780
98.0 787
99.0 793
100.0 800 800
 

gainer

Subscriber
Joined
Sep 20, 2002
Messages
3,703
I'm having a hard time understanding what you have presented here. I would have expected 3 columns: one for the indicated exposure, one for the experimentally determined proper exposure, and the third for the value from the curve of bet fit. I would also have expected to see the equation that represents the curve of best fit.

If I take the curves you presented to be the indicated and the raw experimental data, the curve I presented in the LIRF paper fits quite well. Trouble is, where did you get data for each indicated second up to 100? Before we can draw any conclusions, we need to be sure we are seeing the raw data.
 
OP
OP
Murray@uptowngallery
Joined
Sep 24, 2003
Messages
1,041
Location
Holland, MI
Format
Pinhole
Bad science.

I'll come back with the details.

OK, as you know, other than the Kodak table that gives time and RF-corrected time from 1-100 seconds, and Ilford's graphs, most mfrs now just give stops or time multipliers at a few points. Some do 1, 10, 100 seconds (powers of ten), and the Japanese films tend to use 2-4-8-16 second (powers of 2).

The Foma film is typical of providing corrections at 1, 10,100 seconds.

If I can see an obvious pattern, I can write an equation 'by inspection'. Some films have correction that 'looks' like a(log)t). Sometimes a=1, sometimes it's something less. This is probably not too far off the method you use, but coming at it from a different angle.

Kodak Plus/Tri-X and the Foma ones don't cooperate well with the method that works most easily for me for most films.

So I take the measly few data points given, for example below are the metered and corrected times for Foma 200 Creative, based on the multiplicative correction and not the f-stop correction. They often don't match. I have heard suggested reasons why, but I wonder if it's easier to use if they give 'easy-to-handle' correction rounded to a convenient fraction of a stop. Most people find 1/3 or 1/2 stop far easier to incorporate than 0.172 for example. So I think mfrs may round off.

0.5 1
1 3
10 90
100 1800

Any method should work, but sometimes software generates 'inconvenient' solutions that are more work to convert to the form one may want.

Excel gives you a choice of several types of curves, and you can place the R^2 fit value as well as an equation on the chart(graph). You know all that; I'm explaining both for other readers and in case I reveal a flaw in my logic.

I use Curve Expert because it uses about 30 different models, creates a graph for each, giving you a quick visual sanity check of models that are ridiculously unsuited, like a sinusoidal model that oscillates but 'hits' the few given values right on. This would be a case of using an unsuitable model relevant to a different phenomena. Such is the risk of plugging numbers into software and yelling Eureka when you get an 'answer'.

I didn't show the few data points in my posted table because I assumed people would immediately check those reference values first for validity.

I am not sure I can figure out how to paste a graph in here. (I have to export it to be able to import it). I'll see what I can figure out.

I usually use a 3rd order polynomial for results that seem close enough to me. Some films don't seem to play well with that so I take what gives me what looks like a better fit to me, or I'll do a piecewise function fit, say, one model for 1-5 seconds, another for 3-20 and another for 10-100 (hypothetically speaking). By overlapping the range of each model, I know that each one doesn't get wild just outside the range it was chosen for (I model a wider range than I use it for when possible).

For this film I chose a MMF model (I don't even know what it is).

MMF Model: y=(a*b+c*x^d)/(b+x^d)
Coefficient Data:
a = -0.3211 use these for 1-100 secs
b = 1838.8295
c = 6017.6488
d = 1.4474


MMF Model: y=(a*b+c*x^d)/(b+x^d)
Residual Table:
0.5 -0.378719081
1 0.050141418
10 0.008148474
100 0.012561275

I tried another set of coefficients for 1-5 seconds but it didn't help much.

Coefficient Data: 1-5 secs
a = -0.24793684 MMF Model: y=(a*b+c*x^d)/(b+x^d)
b = 98.695186
c = 321.83251
d = 1.5084278


Nothing gave a good fit at 0.5; not to worry for my needs. I have poor speed control between 1 and 3 seconds anyway.

So what I get to compare is only meaningful at the small number of points the datasheet gave me. If I did my own film testing as some do, I might be trying to fit different data altogether.

I have to interpolate visually. Today I plotted the modeled vs the given data (I can't show you the graph). You can see from the residual table the fit AT THE DATASHEET REFERENCE VALUES is very good. The 'overlaid' graphs don't match perfectly, but it's a curve fit after all, 0.1 stop is <6% and we can both think of a lot of reasons why published reciprocity failure data is an exercise in estimation anyway.

One of the things I was uncomfortable with in my possible misunderstanding of your graphical method is that it seems to assume many films conform to as assumption then use one initial value.

While my method is a lot different, I feel like I'm checking it at ALL the given datasheet values, and doing a sanity check on the shape of the graph.

Other than my unorthodox presentation, so you see a flaw in my logic and/or results?

I'm well aware of claims that published data don't get updated for emulsion batches, and see drastically different results from others' own field measurements. Thus it seems that it's a holy grail to aim for.

That's why I'm happy trying to aim for the published data as a start.

I just re-read your comment that my data seem to fit but where the beep did it come from? I didn't answer that directly, but hopefully did so indirectly.

It's all artist license based on software-suggested best fit, looking for unsuitable curve shape (like if I had enough data to use a 6th order polynomial - the tendency of high order polynomials to have 'instability' or 'oscillation' seems to show up as nonlinearity in the curve outside the range desired. A model is just a model I guess, but 'funny' shapes don't give me any extra confidence I'm close to a solution.

(A little knowledge is dangerous?)
 
Last edited by a moderator:

gainer

Subscriber
Joined
Sep 20, 2002
Messages
3,703
Not any method will work if by "method" you mean the equation you use to fit the data. If you have 3 raw data points, a great many possible equations will fit the data exactly. That is not a good thing, because data of this sort has several sources of random error: measurement of the indicated exposure; setting the indicated exposure; developing the exposed film to a given EI. The chances are pretty good that the curve that fits the measured data exactly will not fit any other exposure settings exactly.

Thus, an equation of the form:

Log[t(c)] = a*Log[t(i)]^b + t(0)

which has 3 arbitrary constants, a, b, and t(0), can be made to fit any 3 data points exactly, even if the data have nothing to do with reciprocity of film exposure. That means that you cannot be sure that any value of corrected exposure that you calculate using the fitted curve will give you a good negative.
 
OP
OP
Murray@uptowngallery
Joined
Sep 24, 2003
Messages
1,041
Location
Holland, MI
Format
Pinhole
"That means that you cannot be sure that any value of corrected exposure that you calculate using the fitted curve will give you a good negative."

That sounds reasonable.

I guess I need to put my film where my mouth is & test against my predictions, also knowing there are other unknowns waiting to bite me.

I had a good feeling that it was a usable method, based on the assumption that wide-spaced mfr data consisting of only a few points was usable. I also figured a smooth curve fit that reasonably approximates the presumed line between the mfr's sparce data points is still not too far from the realm of possibility.

It can't be any worse than someone (an artist rather than technologist) making a linear interpolation between 10 and 100 seconds if they don't see a log (t) factor.

I'll have to shoot some reciprocity-ornery film this spring/summer and see how this plays out.

It's worked for me for chrome film, but they don't need a lot of correction, some of my old shutters are a bit slow (when I know I try to correct for that), so maybe luck is part of it too.
 

gainer

Subscriber
Joined
Sep 20, 2002
Messages
3,703
I don't know why you bother doing the work I already did for you. You missed the point of LIRF if you think it was just to record all that film data in compact form. I tried to show that the LIRF of all the films I tested could br reduced to 1 number for each film, all other parts of the equation depending not on the particular film, but on the indicated time. If you want to have a table of values, let it be a table of basic LIRF times vs indicated time. This table will be T(i) vs T(i)^1.62. When you have measured or otherwise divined the exposure time indicated by your meter, look that value up on the table and multiply the number you find by the film coefficient and add that result to the indicated time to get the total exposure time including the correction for LIRF.

The table is the same for all films that Howard Bond tested within measurement accuracy, and the film coefficient is the same for any film regardless of exposure time.

Your available experimenal sample is much too small to disprove my equation by comparing analysis of variance results with any reasonable estimate of variance of measuring and setting exposures in the camera. In other words, it won't do any good to think you have the best possible curve fit if you don't know the probable errors in the apparatus used to define the curve. It's like what we used to call "Hoisting oneself by one's owun petard." I am also reminded of an old friend's definition of "height of ambition" as "a flea crawling up an elephant's hind leg with intentions of rape."

BTW, the LIRF curve that used to and mabe still is included with Ilford film specs, when plotted on log-log paper, a straight line with a slope of 1.62 as nearly as I can tell.

I'm going to post this and come back if I forgot anything.
 

gainer

Subscriber
Joined
Sep 20, 2002
Messages
3,703
I'm back already.

I should have made it more clear. You need only one table of basic corrections vs indicated exposure time. You need a film coefficient for each different film. You multiply the value from the table by the film coefficient and add the result to the indicated time. You can probably find a place on your view camera to paste the table of basic corrections and another to paste a list of film coefficients.

Or, you can use your pocket calculator to calculate T(i)^1.62, multiply that value by the film coefficient, add T(i) to that result and use that as your exposure time.
 
OP
OP
Murray@uptowngallery
Joined
Sep 24, 2003
Messages
1,041
Location
Holland, MI
Format
Pinhole
OK. Divining. I like that. I'll put a stick in my camera bag too..if I can find it :O)

I'll go read LIRF again. No need to try & invent a square wheel that has a stick already in it's spokes (my idea).

All I want are formulae that give interpolated values. LIRF will do that. There was something I just didn't 'get' initially so I ran wild (ook ,ook) with another primitive idea.

Thanks
 

gainer

Subscriber
Joined
Sep 20, 2002
Messages
3,703
I do agree that the corrections you got to start with are extremely high, even compared very old tri-x specs. The Tri-X at the time Bond did his experiments has a film coefficient of only .17. The Foma is around 1.5 , which means the correction to be added is almost 10 times as great. The lowest he found was for the T-grained films, around 0.05, about 30 times less than the Fomapan data you got. Where your data says to add 80 seconds to a nominal 10 second exposure, Bond's TMAX data would say add less than 3.
 

Ian Grant

Subscriber
Joined
Aug 2, 2004
Messages
23,247
Location
West Midland
Format
Multi Format
Fomapan 100 & 200 Practical Experience of Reciprocity.

Does anyone actually have any first hand practical experience of the true reciprocity of these films.

Foma's recommended factors seem excessive, but looking at older reference books they are way different to any other emulsions.

Ian
 

gainer

Subscriber
Joined
Sep 20, 2002
Messages
3,703
The experimental data should show a reasonably straight line on log-log paper when you plot the amount of correction against the metered exposure. It is so for the data I have seen from Kodak and Ilford. That indicates that on a linear graph, you will see a simple exponential curve starting at 0, 0 and rising to 1700 at 100 metered seconds. That curve is about what we used to see from TRI-X. The corrected exposure at 1 metered second would then be 2 seconds and the correcte exposure at 0.5 seconds would be 0.82 seconds. If you put too much faith in any one correction, no matter what curve you choose to fit, you can get wild results at a different measured one. Youl will be better off to base it all on the added 1700 seconds at measured 100 and use the 1.62 exponent. Thus:

a = 1700/(100^1.62) = 0.978

and

Tc=Tm^1.62*0.978+Tm

This will calculate :

Tm.......Tc
0.5.......0.82
1..........1.98
10.........51
100.......1800
 

gainer

Subscriber
Joined
Sep 20, 2002
Messages
3,703
I forgot to put in the equation. It is:

Tc = Tm^1.62*a+Tm
 

Lee L

Member
Joined
Nov 17, 2004
Messages
3,282
Format
Multi Format
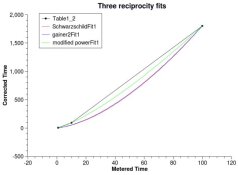
Here are three possible "fits" to the dubious Foma data. There are others as Gainer has mentioned.

First is a traditional Covington/Schwarzschild formula, where 'a' is the Schwarzschild exponent:

a = .61564271125515
corrected time=(1 + metered time)^(1/a)-1

Second is Gainer's formula where 'a' is the film's coefficient:

a = 0.97878930458330
corrected time=a * metered time^1.62 + metered time

Third is a more general form of Gainer's formula, where Gainer's constant 1.62 is replaced with a variable exponent 'b':

a = 3.7492500235851
b = 1.3282527520290

corrected time = a * metered time^b + metered time

Attached is a graph (from QtiPlot) showing the fits of these three curves to the data. Gainer's model is so close to the Covington/Schwarzschild that the red and blue curves blend. The more generalized power formula nails both the 90 and 1800 corrected times, but isn't very good at the 1 second correction.

You can put all these formulae into CurveExpert in the

Apply Fit | User Model | Add User Model

menu for your own future use, and then run a curve fit to them within the program when you plug in some data. They are likely more appropriate for modeling reciprocity failure than many of the other CurveExpert models.

I've switched to a native linux curve fitting program, which also runs on other platforms: QtiPlot.

And remember our ancient motto: GIGO

Lee
 

Attachments

  • FomapanFits.jpg
    FomapanFits.jpg
    24.3 KB · Views: 1,814

Murray Kelly

Member
Joined
Jan 31, 2007
Messages
661
Location
Brisbane, Australia
Format
Sub 35mm
I'm terrible at math. Does anyone have info on the reciprocity failure at the other end of the scale? ie The short, sharp 'flash'? LEDs can switch at 1 microsecond and if I wished to latensify with a LED flash does anyone know whre the inverse square law falls over for short exposure? Looking at Kodak monographs on thier films the limit is - well, - unlimited. At 1/10000 it's still flat.
I ask because I have some recalcitrant Imagelink which allegedly responds positively to 'latensification' and I don't look forward to a half or one hour sitting in the dark with a barely visible green light (why green?) whist it gathers photons to make those pesky shadows developable. At the other end of the scale it i am tempted to think I can make it all hapen in reasonable times.

Murray
 

Ian Grant

Subscriber
Joined
Aug 2, 2004
Messages
23,247
Location
West Midland
Format
Multi Format
Fomapan practical tests

Just did some practical tests and the reciprocity with Fomapan 200 was not at all like the published data.

At 1 second it only only needed around half a stop (recommendation is 1.5 stops) and at lower light levels 10 seconds it was about a stop (not the 3 stops recommended). These test were made in poor daylight 1 second @ f8 100 EI and very low interior lighting 10 seconds @ f8. These are the conditions the film will be used in.

Still need to test how the film behaves with nigh shots, but it seems to be only a little worse than HP5 / Tri-X for reciprocity failure.

Ian
 

thebdt

Member
Joined
May 4, 2008
Messages
70
Location
San Diego, C
Format
35mm
This is disconcerting. I was thinking of using Fomapan 100 as my main film next semester. However, currently I'm using HP5+ with a reciprocity look-up table provided by my instructor. I have a hard enough time wrapping my head around F-Stops; I can't possibly hope to figure my own reciprocity for this film. Since this thread was last posted, has anyone found more tables, data, etc. on Fomapan 100 reciprocity?
 

Ian Grant

Subscriber
Joined
Aug 2, 2004
Messages
23,247
Location
West Midland
Format
Multi Format
The figures given by Foma are alarmist, don't be put off. Testing for yourself is extremely easy and takes no more than the time to shoot half a dozen or so test frames on a roll of film. You may find your HP5 lookup table is close enough.

Ian
 
Joined
Jan 17, 2005
Messages
146
Location
Pennines
Format
4x5 Format
Been using Foma 100 a lot recently and taking shots in rediculously low light. Its a great film. As for the low light issue any metered time between 1 and 10 secs I just double the exposure time. At times over 10 secs metered time I double it then add some! Usually a metered 2 min exposure gets at least 10 mins. At times over a 5 min metered time you know you have entered deep darkness, and you may as well leave the shutter open all night. I've not found it that much different to FP4 apart from being impressed by the way it gives good low tone detail in low light. It does need reduced development though (by about 25%)
 

Maris

Member
Joined
Jan 17, 2006
Messages
1,547
Location
Noosa, Australia
Format
Multi Format
Fomapan 200 reciprocity characteristics are supposed to be easy to test for so I tried. Well it wasn't so straight forward but three 120 rolls later here are some results:

The exposure level I chase in landscape metering is Zone IV = shade side of tree bark, dark rocks, etc. The question becomes "what exposure time extensions must I give for long exposures so I get the same negative densities for Zone IV as at short exposures?" Answers:

Measure 1 second on the meter...give 1.5 seconds
Measure 2 ... give 4
Measure 3 ... give 7
Measure 4 ... give 12
Measure 6 ... give 18
Measure 8 ... give 28
Measure 10 ... give 40
Measure 14 ... give 48

Because I don't own a densitometer the above values are eye approximations arrived at by comparing actual pieces of film side by side on a light box. I am confident I can pick when two densities are the SAME even though I don't know their absolute values.

An experimental constraint that could have been a confounding factor is that the long exposures are made up of several shorter exposures. For example, a forty second exposure is generated out of four ten second exposures. I can't find anything in film technical literature to suggest that a "intermittency effect" is harming my experiment.

I have investigated longer exposures with preliminary results being:

Measure 20 seconds...give 100 seconds
Measure 30 ... give 175
Measure 50 ... give 350
Measure100 ... give 900
These numbers have a more approximate character (wider interpolations) and I want to repeat the experiment some time. The difficulty is achieving close density matches with widely spaced exposure times. Would you believe that doing a long series of consecutive 15 minute exposures is a tedious way to lose an afternoon. You bet.

For completeness I should get around to re-doing these tests with Zone VIII as a target density. Maybe the results will be different. Another thing not measured here is the tendency for reciprocity failure to stretch the contrast of a scene; the bright bits build negative density a lot faster than the lethargic dim bits!

Anyway I have some numbers I believe and I'm going to shoot lots of Fomapan 200 8x10 format at some longish exposures. And I won't be bracketing.
 
Photrio.com contains affiliate links to products. We may receive a commission for purchases made through these links.
To read our full affiliate disclosure statement please click Here.

PHOTRIO PARTNERS EQUALLY FUNDING OUR COMMUNITY:


Ilford ADOX Freestyle Photographic Stearman Press Weldon Color Lab Blue Moon Camera & Machine
Top Bottom