Resource icon

Kodak Tri-X 400TX H+D Curve with Replenished XTOL for 7:30 at 24C in a JOBO

Playing

Playing

  • 0
  • 0
  • 20
On The Mound

A
On The Mound

  • 6
  • 4
  • 143
Finn Slough-Bouquet

A
Finn Slough-Bouquet

  • 0
  • 1
  • 91
Table Rock and the Chimneys

A
Table Rock and the Chimneys

  • 4
  • 0
  • 139
Jizo

D
Jizo

  • 4
  • 1
  • 123

Forum statistics

Threads
197,419
Messages
2,758,687
Members
99,492
Latest member
f8andbethere
Recent bookmarks
1

Adrian Bacon

Member
Joined
Oct 18, 2016
Messages
2,086
Location
Petaluma, CA.
Format
Multi Format
Adrian Bacon submitted a new resource:

Kodak Tri-X 400TX H+D Curve with Replenished XTOL for 7:30 at 24C in a JOBO - A development time resource for replenished XTOL and Tri-X 400TX

For reference, and if anybody wants to discuss.

I've made these exposures as carefully as I could and eliminated as many variables as I realistically could. While it is not scientific, and certainly not up to ISO or probably manufacturer standards, it is as accurate as I can make it with what I have available to me, and certainly accurate enough that I thought it would be share-worthy.

Each of the curve points is a correctly exposed 18 percent grey card in full stop increments using a...

Read more about this resource...
 

foen

Member
Joined
Aug 7, 2013
Messages
95
Location
Italy
Format
Large Format
Good job and thank you for sharing!!!! As I can see, you covered almost film in market, maybe you except tmx 100....
 

Tom Kershaw

Subscriber
Joined
Jun 5, 2004
Messages
4,971
Location
Norfolk, United Kingdom
Format
Multi Format
As it happens I've just come out of the darkroom having processed two rolls of Tri-X '120' in the XTOL-R / Jobo combination. For myself, 7 minutes 30 seconds @ 23C seems to be plenty of time. EI 400 but spot metered for 'zone 3' shadows so may be slightly more exposure than an in-camera centre-weighted metering. My example is from "real world" use so that may explain some of the variability.
 

138S

Member
Joined
Dec 4, 2019
Messages
1,776
Location
Pyrenees
Format
Large Format
Both TX400 and Fomapan 200 (in replenished Xtol) have this steeper slope between, say, Zones II and V, after that settling into a lower slope but not shouldering. Intriguing. Would you care to comment?

Not intriguing... it's just the behaviour shown in the TX400 datasheet. Nice to see a practical test matches the datasheet. That datasheet has not the Xtol plot, but it has the D-76 and the T-Max developer ones

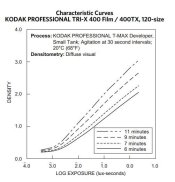
This is the T-max one, also straight line at 1 lux·second (H Log = 0.0 in the graph) and beyond, which is 6 stops overexposure, with T-Max developer showing some speed advantage, 1/3 stop approx. higher than with xtol, as it could be predicted:

SP32-20200617-162000.jpg

The D-76 plot is a bit more shouldered because that developer is semi-compensating type.
 
Last edited:
OP
OP
Adrian Bacon

Adrian Bacon

Member
Joined
Oct 18, 2016
Messages
2,086
Location
Petaluma, CA.
Format
Multi Format
Both TX400 and Fomapan 200 (in replenished Xtol) have this steeper slope between, say, Zones II and V, after that settling into a lower slope but not shouldering. Intriguing. Would you care to comment?

It is continuous agitation, so the time is the minimum time for zone 5 to get up to ~0.85. The shadow zones don’t have the benefit of extended time to build density that you would see with intermittent agitation. If I used replenished xtol and only agitated once a minute, and worked out a time to still get zone 5 to 0.85, the shadows would have a lot more density. You can see that from the other longer times. I could easily pick up more toe speed and density with less agitation. Both 400TX and fomapan 200 show more zone 1 density at the same EI with more development time. The trade off is highlight density, but if you slow down agitation, you can keep that in check.
 
OP
OP
Adrian Bacon

Adrian Bacon

Member
Joined
Oct 18, 2016
Messages
2,086
Location
Petaluma, CA.
Format
Multi Format
Another question, do you not consider pre wash right?Simply putting developer into tank

no prewash, that dilutes your working solution over time and you have to Increase the replenishment rate to compensate. I just do the standard 70ml per 80 square inches replenishment rate.
 

138S

Member
Joined
Dec 4, 2019
Messages
1,776
Location
Pyrenees
Format
Large Format
Another question, do you not consider pre wash right?Simply putting developer into tank

(beyond dilution effect) There is no problem in making a long enough pre wash, a too short pre-wash may lead to uneven developent.

Modern emulsions from main manufacturers (since decades ago) include surfactants that ensure an even development with no kind of pre washing, if you pre wash then you remove those surfactants and you have a risk to have an uneven development. So pre wash is not necessary and if not well performed it may bring on problems. Single situation when pre wash is needed is for shuffle method.

ilford datasheets for fims state: "A pre-rinse is not recommended as it can lead to uneven processing."

Pre-wash was a good recomendation for films made many decades ago, and you may find that recommendation in ancient literature from very reputed photographers. But film form main manufacturers has changed since then and that recommendation today is obsolete, reason is the that today those emulsions from main manufacturers have changed and they contain the right surfactants to not use pre wash, with the shuffle method exception.
 

foen

Member
Joined
Aug 7, 2013
Messages
95
Location
Italy
Format
Large Format
Thank you for replies , i used to pre wash (shortly) only for set same temperatures between tank/film and developer
 

138S

Member
Joined
Dec 4, 2019
Messages
1,776
Location
Pyrenees
Format
Large Format
Thank you for replies , i used to pre wash (shortly) only for set same temperatures between tank/film and developer

This is the risky way, if you pre wash you should do it for the right time, it's is a short pre wash that may end in uneven development, if you pre wash do it for the full recommended time.

If your darkroom is far from 20ºC you can simply pre wash the tank, but in that situation better having a tray with some water at 20º and put the tank and the developer's bottle in it.
 

radiant

Member
Joined
Aug 18, 2019
Messages
2,135
Location
Europe
Format
Hybrid
Adrian, thanks for sharing these.

Stupid questions probably:
- where the zone reference curve is originating? do you have the data to give?
- where the ISO 400 reference is from? or is it calculated for this graph?

And even more stupid question: why X-axis is in lux-seconds in these kind of graphs? I would guess stops is more understandable unit?
 

radiant

Member
Joined
Aug 18, 2019
Messages
2,135
Location
Europe
Format
Hybrid
I plotted all in same and converted densities to stops and lux seconds to zones for example:


trix.PNG


Adrian I think you have typo in EI 250 row "0.400" - I think it should be 0.04 ?
 

ic-racer

Member
Joined
Feb 25, 2007
Messages
16,481
Location
USA
Format
Multi Format
Very confusing way of presenting the data. For example, with respect to the orange line; the 0.1 log D (which is confusingly converted to stops) is shown at the number "2" So that is a contradiction, because the exposure index is defined as zone 1 being 0.1 log D.
 

ic-racer

Member
Joined
Feb 25, 2007
Messages
16,481
Location
USA
Format
Multi Format
For example, if one is not able to plot absolute lux-sec values on the X-axis, one can plot the step wedge number (ie 21 to 0) or the reflection densities from a photographed reflection gray scale (ie 1.9 to 0.1). I have attached a scan of Kodak Graph paper that was designed to make curves easy to construct and understand.

Kodak Curve Plotting Graph Paper.jpg
 

radiant

Member
Joined
Aug 18, 2019
Messages
2,135
Location
Europe
Format
Hybrid
Very confusing way of presenting the data. For example, with respect to the orange line; the 0.1 log D (which is confusingly converted to stops) is shown at the number "2" So that is a contradiction, because the exposure index is defined as zone 1 being 0.1 log D.

Why is it confusing? It is just different scale which is more commonly used (stops and zones). Showing zones is easier to understand how the zone is represented on film. You can also see how long the film density can be in stops.

Adrians data shows "0.070 Zone 1" so that is where I picked the value.
 
OP
OP
Adrian Bacon

Adrian Bacon

Member
Joined
Oct 18, 2016
Messages
2,086
Location
Petaluma, CA.
Format
Multi Format
Adrian, thanks for sharing these.

Stupid questions probably:
- where the zone reference curve is originating? do you have the data to give?
- where the ISO 400 reference is from? or is it calculated for this graph?

And even more stupid question: why X-axis is in lux-seconds in these kind of graphs? I would guess stops is more understandable unit?

zone reference is from @RalphLambrecht book, beyond monochrome. Though it’s also relatively easy to find online.
ISO reference is from the ISO standard for calculating bw film speed, same for lux seconds. @Bill Burk and I worked out the look of the graph on a thread here on Photrio a while back.
 
OP
OP
Adrian Bacon

Adrian Bacon

Member
Joined
Oct 18, 2016
Messages
2,086
Location
Petaluma, CA.
Format
Multi Format
Why is it confusing? It is just different scale which is more commonly used (stops and zones). Showing zones is easier to understand how the zone is represented on film. You can also see how long the film density can be in stops.

Adrians data shows "0.070 Zone 1" so that is where I picked the value.

the chart I posted already shows stops and zones. Each dot is a different full stop of exposure. You can simply replace lux seconds with relative EV with zone 5 being 0 EV, everything to the right is plus, everything to the left, minus. Keep the density on the vertical axis as that is the optical transmission of the developed film for each point. Showing it as exposure stops isn’t useful.
 

radiant

Member
Joined
Aug 18, 2019
Messages
2,135
Location
Europe
Format
Hybrid
I know that these charts have used lux-seconds and density as axis, that is the tradition. For person who hasn't been examining these the units are arbitary, meaning nothing. That made me wonder what actually are these units.

If X-axis is shown as zones, you can easily see that the linear part starts from Zone II and continues over Zone X for one stop, if I analyse correctly. And see that the film is pretty linear for 9 zones.

The Y-axis in stops is of course not so useful, but I would still prefer density as stops because that is also known unit. For example salt print needs by my calculations 8 stops of density, one can check that from the chart too.

I know this is controversial to the traditons and my post won't change anything, but I don't understand why you just claim that it is not useful just because I use other practical units..

Adrian: btw why the other measurements (orange + gray) are so much different to the blue one? And why did you measure just the toe?
 
OP
OP
Adrian Bacon

Adrian Bacon

Member
Joined
Oct 18, 2016
Messages
2,086
Location
Petaluma, CA.
Format
Multi Format
The Y-axis in stops is of course not so useful, but I would still prefer density as stops because that is also known unit

Density in log units is also a known value. It may not be known to you, but has been the standard since pretty much forever.

I know this is controversial to the traditons and my post won't change anything, but I don't understand why you just claim that it is not useful just because I use other practical units..

the purpose of the charts I posted is to show the H+D curve relative to zone and ISO standards, which is useful to a significant number of members, based on what other members have already said, your chart is useful to you, hence my comment. If you feel that many members will find the way you charted it as useful, then feel free to post dedicated resource pages for them.

Adrian: btw why the other measurements (orange + gray) are so much different to the blue one? And why did you measure just the toe?

different times and/or exposure indexes. I was measuring the toe because that’s how you determine film speed, and I was determining the best exposure index and development time to use. I included the measurements in the post for reference in case anybody wanted to use them as a starting point for something else. As I said before, doing this costs time and money, and I can’t please everybody.
 

radiant

Member
Joined
Aug 18, 2019
Messages
2,135
Location
Europe
Format
Hybrid
If you feel that many members will find the way you charted it as useful, then feel free to post dedicated resource pages for them.

Ok, the usefulness is just because of different units. I thought I made some fundamental mistake in conversion or something that renders the data unusable.

I doubt anyone finds my units useful but those are at least it helps my understanding of what is really happening because stops are much familiar at least for me.

different times and/or exposure indexes.

Of course but why such radical difference, that is quite interesting. And developing longer seems to lower the density? That cannot be correct? I have probably understood something incorrectly.

As I said before, doing this costs time and money, and I can’t please everybody.

Of course and I don't have any complaints about the work you have done. Couldn't ask for more.

I am bit tempted to do my own H+D tests for sure :smile:
 
OP
OP
Adrian Bacon

Adrian Bacon

Member
Joined
Oct 18, 2016
Messages
2,086
Location
Petaluma, CA.
Format
Multi Format
Of course but why such radical difference, that is quite interesting. And developing longer seems to lower the density? That cannot be correct? I have probably understood something incorrectly.

Where are you seeing less density with longer development? The 8:45 time has more density than the 7:30 time. A lot more. You’re probably not converting to stops correctly.
 

radiant

Member
Joined
Aug 18, 2019
Messages
2,135
Location
Europe
Format
Hybrid
Where are you seeing less density with longer development? The 8:45 time has more density than the 7:30 time. A lot more. You’re probably not converting to stops correctly.

I have made mistake, yes. I looked at your data and it has more density for sure. Sorry about that!
 
Photrio.com contains affiliate links to products. We may receive a commission for purchases made through these links.
To read our full affiliate disclosure statement please click Here.

PHOTRIO PARTNERS EQUALLY FUNDING OUR COMMUNITY:


Ilford ADOX Freestyle Photographic Stearman Press Weldon Color Lab Blue Moon Camera & Machine
Top Bottom