spectral sensitivity of Ilford HP5+ is for Daylight?

Finn Slough Fishing Net

A
Finn Slough Fishing Net

  • 0
  • 0
  • 20
Dried roses

A
Dried roses

  • 5
  • 0
  • 54
Hot Rod

A
Hot Rod

  • 3
  • 0
  • 71
Relics

A
Relics

  • 2
  • 0
  • 59
The Long Walk

A
The Long Walk

  • 3
  • 0
  • 76

Recent Classifieds

Forum statistics

Threads
197,453
Messages
2,759,197
Members
99,503
Latest member
Jsculuca
Recent bookmarks
0

shyguy

Member
Joined
Apr 25, 2005
Messages
128
Location
North East U
Format
Large Format
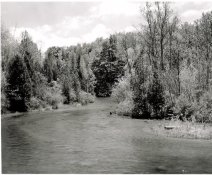
Can anyone tell me what the spectral sensitivity of Ilford HP5+ is for Daylight?

I shot with this film the other day a river lined with deciduous trees of various types. I had a red #25 and a polarizer in place. The resulting image was quite remarkable in that it looked almost like a infrared image. At least within the trees.

S.
 

Attachments

  • Untitled2a.jpg
    Untitled2a.jpg
    150.1 KB · Views: 208

colrehogan

Member
Joined
May 11, 2004
Messages
2,011
Location
St. Louis, M
Format
Large Format Pan
Well the Ilford specs on this film show the spectral sensitivity as measured against tungsten light, not daylight. It looks like the film's sensitivity falls off drastically after about 630 nm and I think that this corresponds to the red part of the spectrum, though I don't know exactly where the near IR begins off the top of my head. 700 nm, maybe?

Besides, your leaves aren't white enough and your sky and water aren't dark enough when compared to a possible rendition of this scene in IR.

http://www.ilford.com/html/us_english/pdf/HP5_Plus.pdf
 

127

Member
Joined
Feb 6, 2004
Messages
580
Location
uk
Format
127 Format
I've tried to make sense of ilfords spectral graphs before and conlcuded that they're totally meaningless...

They're labelled as sensitivity, but are measured against tungsten... To me that makes no sense.

If it's a sensitivity then (to my understanding) it should be measured by firing unit energy (W/nm) of each frequency, and measuring the result, or if a particular light source is used, then it should be normalized post-measurement, so that the light source used is irrelevant.

Unless the results are normalized then the graph is a RESPONSE, rather than a sensitivity. You'd need to divide by the tungsten spectrum, then multiply by the daylight spectrum to get a daylight RESPONSE.

Even if they could decide what they're plotting, the y-axis label is dubious - it's labeled as 1.0 and 0.5 which sugguests it's linear, but log would be more appropriate (Kodak are much clearer in this respect).

Finally even if we could figure out what it's a graph OF it's way too small, and rough to be of any real use.

When choosing a filter we've got the kodak filter book which lists the spectral response numerically at 10 nm intervals, along with clearly labeled graphs. Unfortunatly that becomes virtually meaningless without the the equivalent data for the film.

I did some nice simulations of filters, surfaces and lights, but got could never find any film data to complete the system (I did email ilford, but got no response). If anyone has any good data for ANY film, I'd love to see it...

Ian
 
Photrio.com contains affiliate links to products. We may receive a commission for purchases made through these links.
To read our full affiliate disclosure statement please click Here.

PHOTRIO PARTNERS EQUALLY FUNDING OUR COMMUNITY:


Ilford ADOX Freestyle Photographic Stearman Press Weldon Color Lab Blue Moon Camera & Machine
Top Bottom